Anvar Mustafazade

0 %
Anvar Mustafazade
Business Development
& Innovation Strategist
  • Residence:
    United States
  • City:
    Washington
  • Status:
    Graduate Student
English
Turkish
Russian
  • Business Planning & Strategy
  • Data Analysis & Research
  • Entrepreneurship & Innovation
  • Financial Analysis
  • Branding & Communication
Advanced Excel
Stata
Python
Adobe Tools
Tableau
CRM Systems
PM Tools

Tableau Project: Monthly Profitability Analysis

Tableau

Project details

Description

This chart compares the number of profitable and unprofitable days per month. Using calculated fields in Tableau, days with total profit greater than zero were classified as profitable.


The analysis highlights cyclical profitability trends and provides a visual understanding of business volatility and loss control.

  • Tool:
    Tableau
  • Dataset
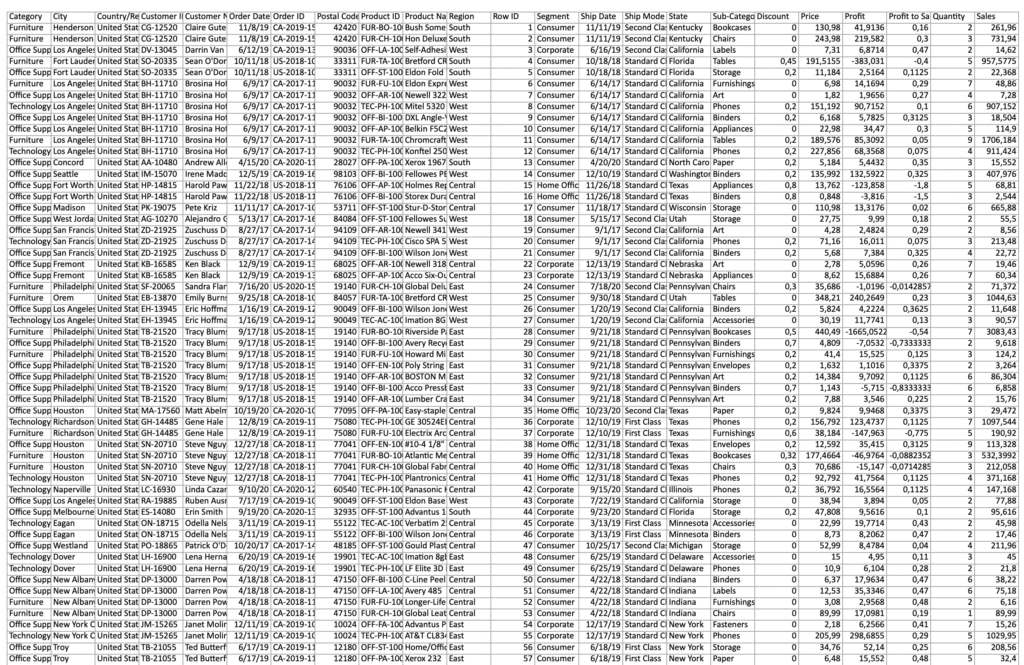
    Superstore Orders Dataset
  • Data Analysed:
    4 years of monthly sales performance (2016–2020)
  • Visualisation Type
    Dual Line Chart

Dataset

Results (Interactive Tableau Dashboard)

Ready to grow your business?

Let's work together!
Contact me