Description
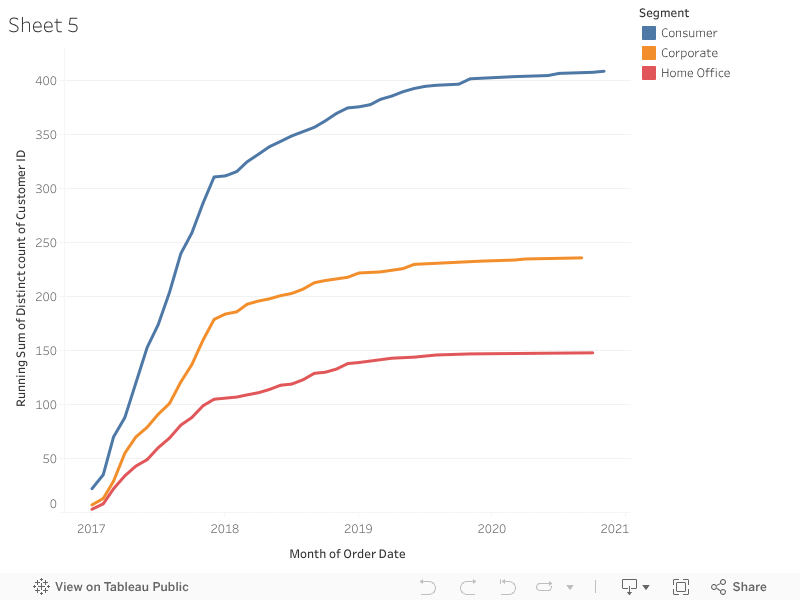
This visualization tracks the cumulative growth of unique customers across three key market segments (Consumer, Corporate, and Home Office).
The chart demonstrates that the Consumer segment consistently contributed the largest share of new customers, followed by Corporate, while Home Office remained steady but smaller. This running sum approach helps businesses monitor long-term segment performance and customer acquisition dynamics.