Research Purpose
The goal of this study was to test whether fundamental analysis can predict future returns.
Using Piotroski’s nine-factor model, I evaluated how profitability, leverage, liquidity, and efficiency indicators influence market performance.
The project combines financial data analysis, ratio computation, statistical testing, and investment simulation, effectively bridging academic finance concepts with real-world portfolio strategy.
Data and Preparation
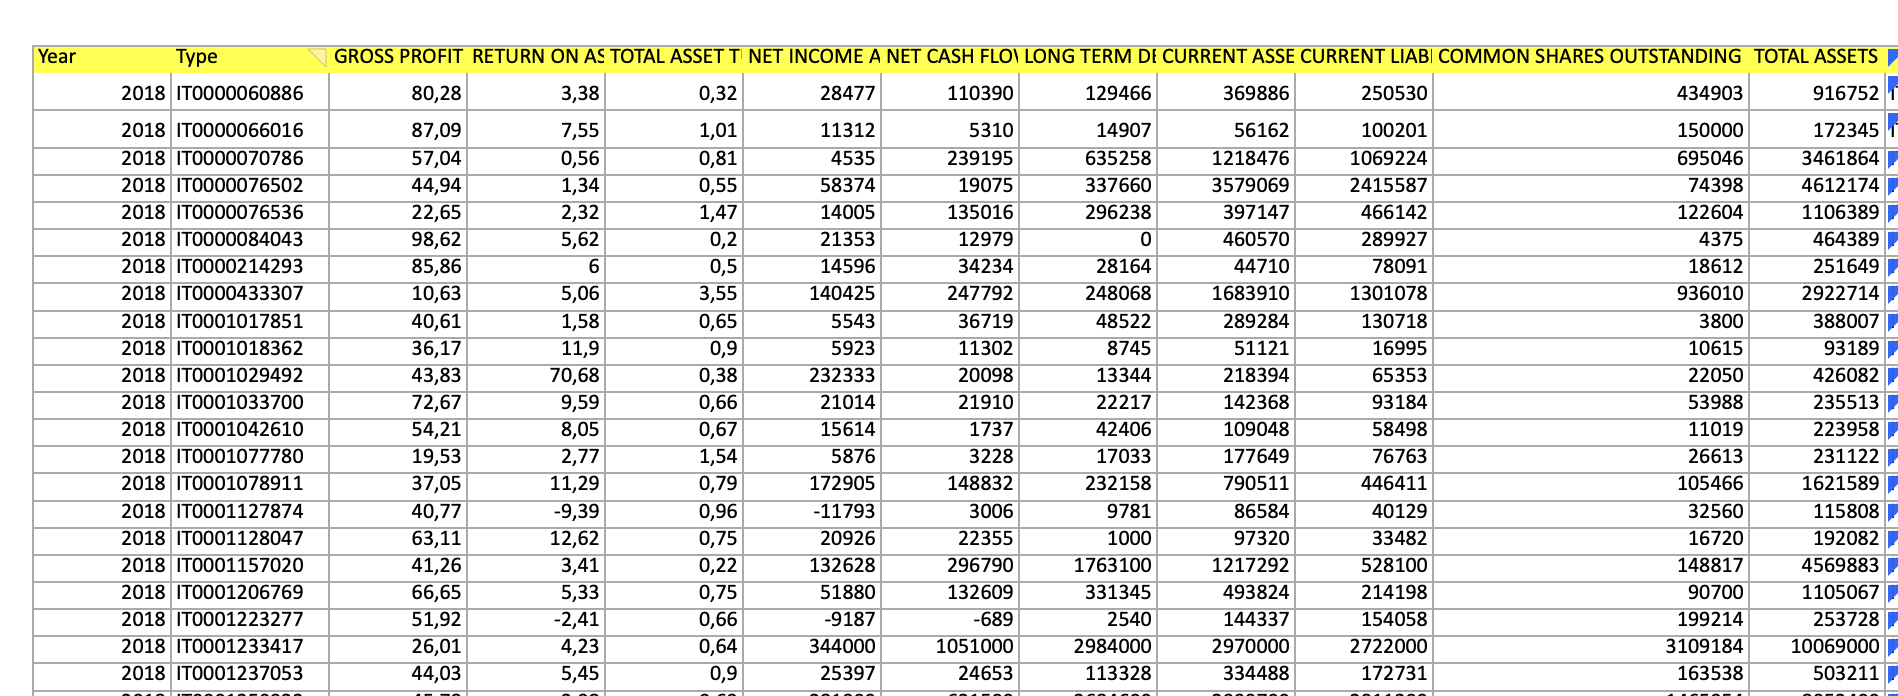
The dataset contains firm-level financial data from 2011 to 2023, including:
- Gross Profit, Return on Assets (ROA), Asset Turnover, Net Income,
Operating Cash Flow, Leverage Ratios, Liquidity, Shares Outstanding, and Total Assets.
Each record represents a company-year observation.
After cleaning and normalizing the data, I created additional calculated fields (Δ variables) to capture year-to-year changes in performance indicators.
The cleaned dataset then served as the base for the Piotroski F-Score calculation and portfolio construction.
Methodology: Calculating the F-Score
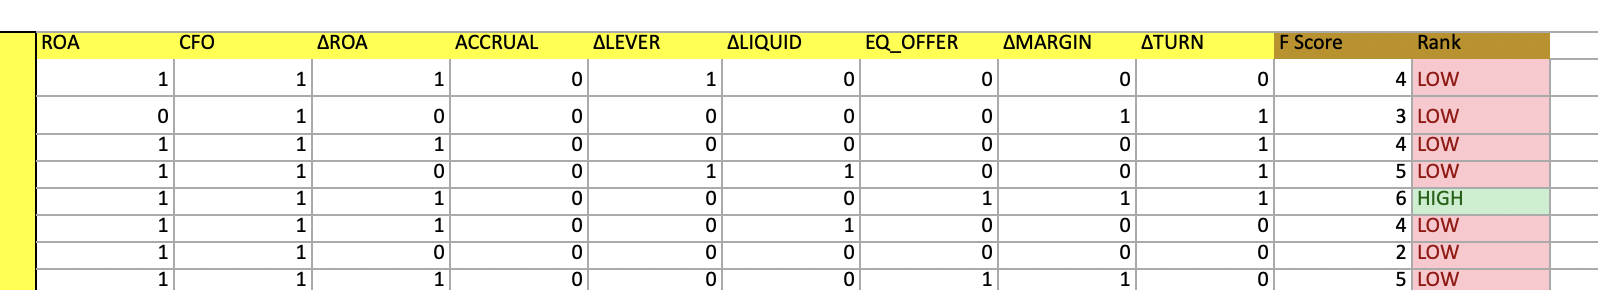
The Piotroski F-Score ranges from 0 to 9 and is based on nine binary indicators grouped into three main categories:
| Category | Variable | Condition for Score = 1 |
|---|
| Profitability | ROA | Return on Assets > 0 |
| | CFO | Positive Cash Flow from Operations |
| | ΔROA | ROA improved vs. last year |
| | ACCRUAL | CFO > Net Income |
| Leverage, Liquidity, and Funding | ΔLEVER | Leverage decreased |
| | ΔLIQUID | Current ratio improved |
| | EQ_OFFER | No new shares issued |
| Operating Efficiency | ΔMARGIN | Gross margin increased |
| | ΔTURN | Asset turnover increased |
Each company receives a score of 1 for each condition met and 0 otherwise.
High F-Score (6–9): Financially strong, undervalued firms likely to outperform.
Low F-Score (0–5): Financially weak firms with higher risk and lower expected returns.
This scoring system transforms complex accounting data into a single, interpretable signal for investors.
Return Calculation (HRET)
To evaluate performance, I calculated Holding-Period Returns (HRET) using the formula:
HRET=(Vt+1−Vt)/Vt
where Vt and Vt+1 are firm values in consecutive years.
HRET measures how much a firm’s value grows or declines from one year to the next.
I grouped the firms into High and Low F-Score portfolios and compared them with a Market portfolio that tracks the general index.
This allowed me to analyze how financial strength translates into real investment outcomes.
Portfolio Performance Summary (2012–2023)
| Metric | High F-Score | Low F-Score | Market |
|---|
| Average Return (All Years) | 0.0530% | 0.0311% | 0.0345% |
| Standard Deviation (Volatility) | 1.0781% | 0.9244% | 1.4530% |
| Value at Risk (95%) | 1.8265% | 1.5517% | 2.4248% |
| Average Sharpe Ratio | 4.90% | 3.35% | 2.37% |
Interpretation
- The High F-Score portfolio generated the highest daily average returns and the best risk-adjusted performance (Sharpe Ratio).
- Despite slightly higher volatility, it was more efficient than the Low or Market portfolios.
- The Market portfolio was the most volatile, while Low F-Score firms had smaller but less stable returns.
- Overall, stronger fundamentals led to superior long-term performance.
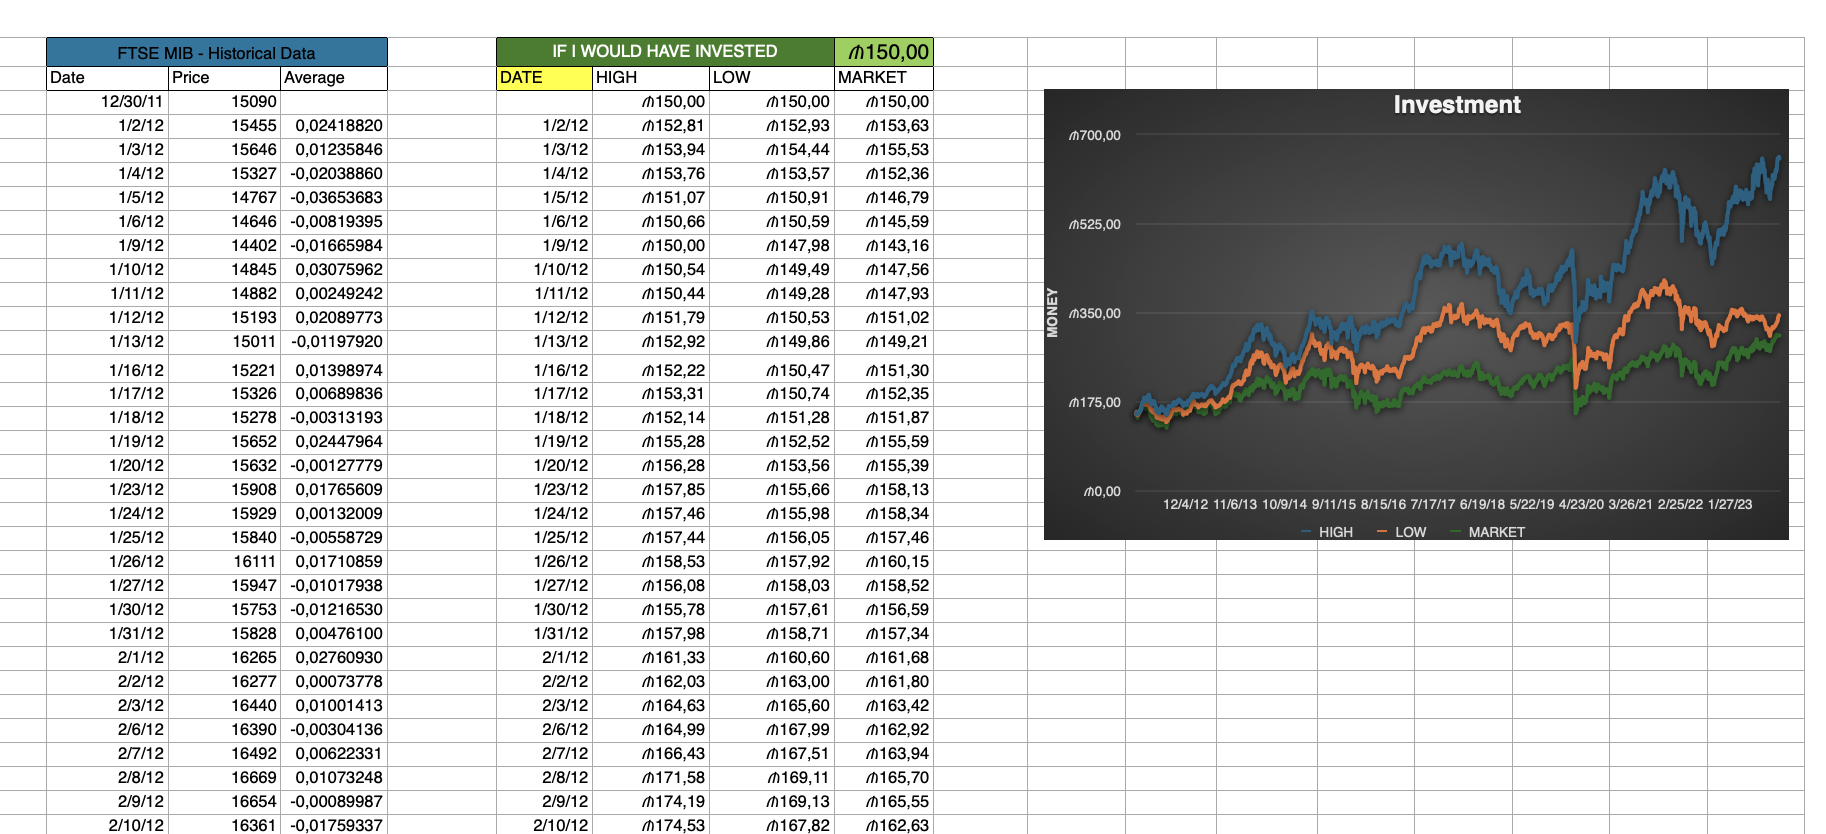
Investment Simulation
To visualize portfolio growth, I simulated an equal investment of $150 in each portfolio at the start of 2012.
| Portfolio | Final Value (Dec 29 2023) | Total Growth | CAGR (Annualized Return) |
|---|
| High F-Score Portfolio | $652.45 | +335 % | ≈ 14.7 % per year |
| Low F-Score Portfolio | $345.95 | +131 % | ≈ 8.2 % per year |
| Market Portfolio | $305.40 | +103 % | ≈ 7.0 % per year |
The investor who picked companies with high F-Scores would have quadrupled their capital, while the market and low-score portfolios only doubled.
This confirms that focusing on financially healthy, fundamentally strong firms yields superior compound returns.
Performance Metrics Explained
- Average Return shows how much profit the portfolio made daily on average.
- Standard Deviation reflects how volatile or risky the portfolio was.
- Value at Risk (VaR) estimates the maximum likely loss in one period (with 95% confidence).
- Sharpe Ratio measures how much return was achieved for each unit of risk — higher is better.
Across almost every metric, the High F-Score portfolio performed the best, showing that high-quality firms deliver both higher returns and better stability over time.
Key Findings
- Fundamentally strong companies outperform weaker firms and market averages.
- The F-Score is a reliable quantitative tool for identifying undervalued but stable firms.
- Risk-adjusted returns (Sharpe Ratio) confirm that strong fundamentals lead to efficient performance.
- This method combines academic theory, statistical analysis, and practical portfolio management — making it a replicable model for long-term investors.
Conclusion
This project demonstrates how quantitative accounting analysis can be applied to real-world investing.
By integrating financial ratios, risk metrics, and data-driven classification, the study provides a clear link between financial health and market performance.
It validates the idea that fundamental strength creates long-term value and that even simple, transparent models like the Piotroski F-Score can outperform the market when applied systematically.
The findings reinforce the importance of data-driven decision-making in finance and provide a foundation for further research into AI-based financial modeling, factor investing, and performance forecasting.