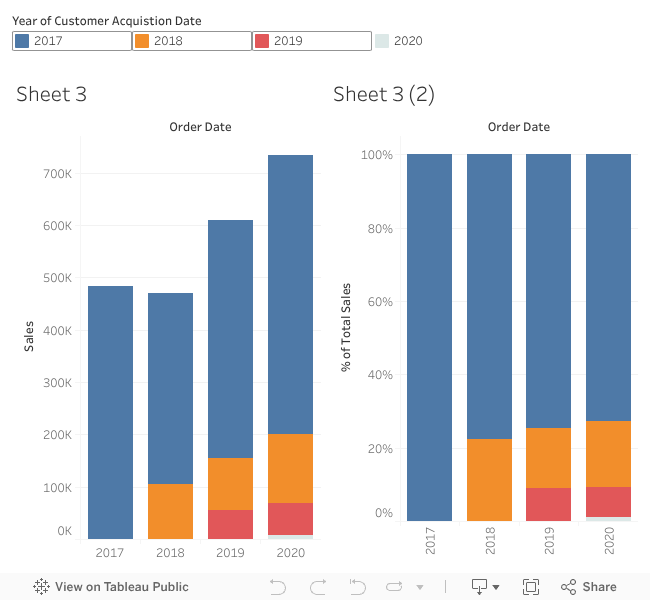
Description
This chart visualizes annual sales categorized by the year of customer acquisition, enabling cohort comparison.
It shows how customers acquired in earlier years (2017–2018) continued to generate the majority of revenue in subsequent years, emphasizing retention and long-term value of early adopters.
The accompanying percentage view allows for proportional comparison, offering insights into the sustainability of each acquisition year’s contribution to total sales.